
Introducing our new feature - Context at the point of data

Our new feature moniteyeVision™note📝 lets you add free-text annotations directly on any data point in moniteyeVision™. This means you can flag a false alert, acknowledge a spike, or leave a quick note for colleagues on the datapoint itself.
Not only can you annotate your graphs, but now you can also highlight a point in your data and request a consultation on it from one of our dedicated experts. Just click the ‘Schedule Data Review’ button, and we will do the rest!
How it works
Click the data point you want to explain;
Type a short note and save; or
Click ‘Schedule Data Review’ to discuss the data with one of the Moniteye team.
Notes appear as subtle callouts and in tooltips, are timestamped, and will include the username - it means users now have that human context layer on top of sensor data.
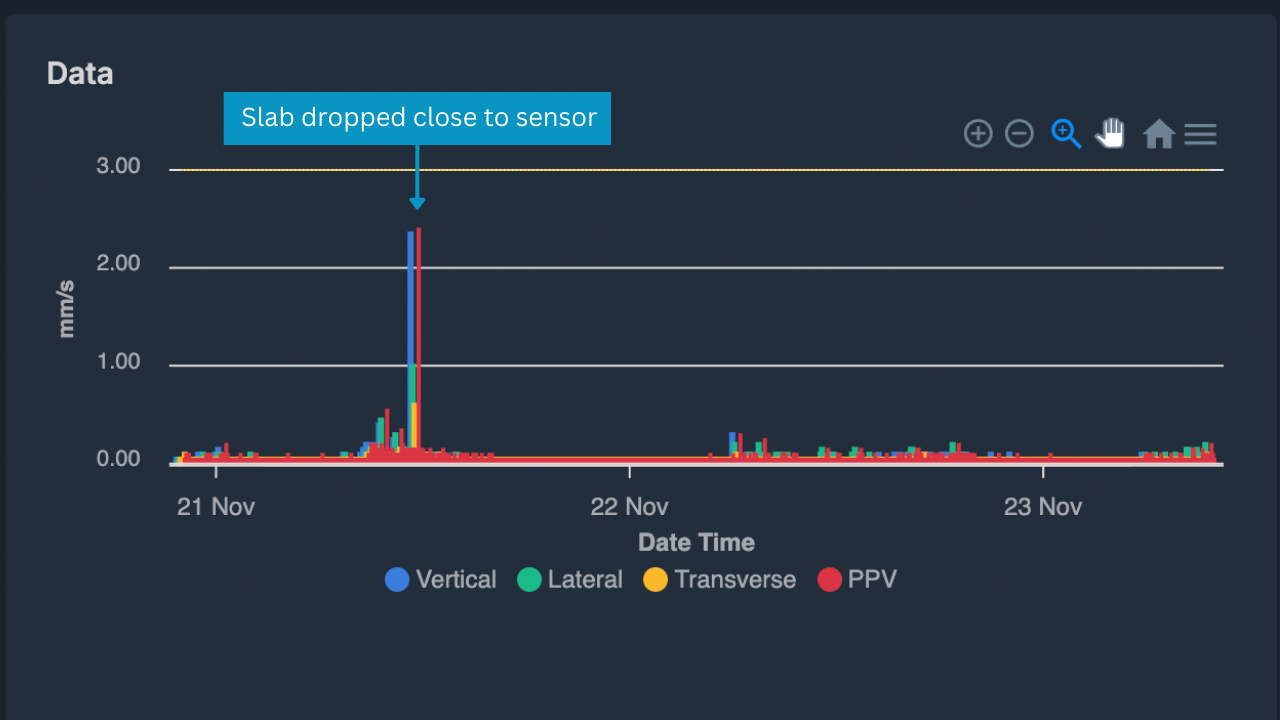
Annotate your graphs for better insights into your data
Why it matters
Reduces investigation time by clarifying spikes and any big changes instantly;
Reduce noise and build trust in alerts by marking false positives;
Reduce guess work by consulting the Moniteye team about any data you’re not sure of automatically;
Can be used as a site diary to allow users to go back and check what was happening that day - useful for site managers wanting another way to manage.
Getting started
Open any moniteyeVision™ chart → click a point → add your note. Shared with your existing project team by default.

Worried about a data spike? We’ll have a look and give you a call.
The bigger picture
moniteyeVision™note📝 is part of our push to make moniteyeVision™ not just a place to view data, but a place to work with it: acknowledging events, collaborating in context, and making our graphs a reliable place of record rather than a contextless graph or two. Let us know if you’d like us to walkthrough this new feature or could think of any use cases that might need a slightly different workflow.
Add meaningful context to your charts and make quicker, better decisions